Direct mail postcard tracking methods separate profitable campaigns from expensive guesses. Every business owner who’s mailed postcards knows the anxiety: cards go out, money is spent, and then… silence. Did anyone respond? Did the campaign work? Without proper tracking, you’re flying blind—unable to optimize, unable to scale, unable to justify continued investment. In 2026, the businesses maximizing postcard ROI aren’t hoping their campaigns work. They’re measuring every response with precision. Here’s how to track postcard performance with the same rigor you’d apply to digital advertising.
Codes
Numbers
+ UTM
Pages
Sale Ask
Analysis
Why Tracking Matters More Than You Think
Direct mail postcard tracking methods aren’t optional—they’re essential for three reasons.
Budget justification: When you can prove a $1,500 postcard campaign generated $12,000 in revenue, future marketing budgets become easier to secure.
Campaign optimization: Tracking reveals which offers, designs, and lists perform best. Without data, you’re repeating the same mistakes.
True ROI calculation: Gut feelings don’t count. Consequently, actual response numbers—tied to actual revenue—tell you whether postcards deserve more investment or less.
The businesses scaling direct mail programs track obsessively. Meanwhile, the businesses abandoning “ineffective” campaigns often never tracked at all.
Method 1: Unique Offer Codes
The simplest and most reliable direct mail postcard tracking method. Specifically, each campaign gets a unique code that customers mention, enter, or present to redeem an offer.
How it works:
- Print a unique code on each campaign (“SPRING26” or “SAVE50MAY”)
- Train staff to ask for and log codes at point of sale
- Count redemptions to calculate response rate
Best practices:
- Keep codes simple and easy to remember
- Use different codes for different audience segments
- Create a logging system staff will actually use
- Accept codes even if customers forget—ask “Did you receive our postcard?”
Pros: Simple, low cost, requires no technology
Cons: Relies on staff compliance and customer memory
Response rate calculation:
Redemptions ÷ Postcards mailed × 100 = Response rate
Example: 45 redemptions from 1,500 postcards = 3.0% response rate (solid performance compared to industry benchmarks of 1-5% for cold prospects)
Method 2: Dedicated Phone Numbers
Campaign-specific tracking numbers route calls to your main line while logging every call’s source.
How it works:
- Purchase a tracking number from services like CallRail, CallTrackingMetrics, or WhatConverts
- Print the tracking number on postcards instead of your main number
- The service logs all calls, recording volume, duration, and optionally call recordings
- Calls forward seamlessly to your regular line
Best practices:
- Use local area codes to maintain trust
- Keep numbers active for 60–90 days after mailing to capture delayed responses
- Review call recordings to assess lead quality
- Set up different numbers for different campaigns or audience segments
Pros: Captures calls without requiring customer action; provides detailed analytics
Cons: Monthly cost ($30–$100); requires setup and management
Response rate calculation:
Calls received ÷ Postcards mailed × 100 = Response rate
Method 3: QR Codes with UTM Parameters
QR codes bridge physical mail to digital tracking. When scanned, they direct users to campaign-specific URLs that Google Analytics can track.
How it works:
- Generate a QR code using a QR code generator linking to a landing page with UTM parameters
- Example URL: yourbusiness.com/offer?utm_source=postcard&utm_medium=direct_mail&utm_campaign=spring2026
- Use Google’s Campaign URL Builder to create properly formatted tracking URLs
- Google Analytics captures visits, time on site, and conversions
- QR scanning services also provide scan counts
Best practices:
- Link to a dedicated landing page—not your homepage
- Keep the landing page focused on the postcard offer
- Test QR codes before printing to ensure they scan properly
- Make QR codes large enough (minimum 1″ × 1″) per design best practices
- Include a short URL alongside for people who prefer typing
Pros: Precise digital tracking; captures online conversions; free with Google Analytics
Cons: Misses phone calls and walk-ins; requires recipients to scan
Response rate calculation:
QR scans or page visits ÷ Postcards mailed × 100 = Response rate
Method 4: Unique Landing Pages
Campaign-specific URLs make attribution unmistakable. Specifically, any traffic to that page came from the postcard.
How it works:
- Create a simple, memorable URL (yourbusiness.com/spring26)
- Print only this URL on the postcard
- Track all traffic to that page as postcard-attributed
Best practices:
- Keep URLs short and easy to type
- Use lowercase letters only
- Redirect the page to your main site after campaign ends
- Include conversion tracking (form submissions, appointment bookings)
Pros: Clean attribution; no special technology required; easy to set up
Cons: Requires creating landing pages per campaign; misses phone responses
Method 5: Ask at Point of Sale
The lowest-tech approach: simply ask every customer how they heard about you.
How it works:
- Train staff to ask “How did you hear about us?” during every transaction
- Log responses in your POS system or a simple spreadsheet
- Tally postcard mentions to calculate attributed responses
Best practices:
- Make the question part of standard checkout procedure
- Provide specific options (“Did you receive our postcard?”) rather than open-ended questions
- Track consistently across all staff and locations
- Review data weekly to spot trends
This method works particularly well for small business campaigns and grand opening events where face-to-face interactions are common.
Pros: Captures all channels; costs nothing; simple to implement
Cons: Relies on customer recall and staff consistency; less precise than other methods
Method 6: Matchback Analysis
For campaigns without offer codes or tracking numbers, matchback analysis compares customer data against mailing lists to identify likely responders.
How it works:
- After a campaign, export new customers acquired during the response window
- Match customer addresses against the mailing list
- Customers whose addresses appear on the mailing list are attributed to the campaign
Best practices:
- Define a reasonable response window (typically 2–6 weeks post-mail)
- Account for household members with different names
- Use address standardization to improve match rates
- Consider this method directional rather than precise
This approach is particularly useful for EDDM® campaigns where individual tracking is more challenging.
Pros: Works retroactively; captures responses regardless of tracking mechanism
Cons: Less precise; may over-attribute; requires address data from new customers
Combining Methods for Complete Tracking
The most accurate direct mail postcard tracking methods combine multiple approaches.
Example multi-method tracking:
- Unique offer code for in-store redemptions
- Dedicated phone number for call tracking
- QR code linking to campaign landing page
- “How did you hear about us?” as backup capture
This layered approach catches responses across all channels. For instance, someone who calls without mentioning a code still gets tracked through the phone number. Someone who visits online without scanning gets captured through matchback.
Ready to implement professional-grade campaign tracking? Request a detailed quote for postcard printing with integrated tracking solutions. Our team specializes in direct mail campaigns with built-in response measurement, helping you understand exactly which postcards drive which results. Whether you’re mailing 1,000 or 100,000 pieces, we’ll help you track performance with precision.
Call 845-255-5722 to discuss tracking methods, response rate optimization, or integrated campaign analytics.
Calculating True Response Rate
Once you’ve collected response data, calculate response rate properly.
Basic formula:
Total tracked responses ÷ Total postcards mailed × 100 = Response rate
Adjusted formula (accounting for undeliverables):
Total tracked responses ÷ (Postcards mailed – Undeliverable returns) × 100 = Adjusted response rate
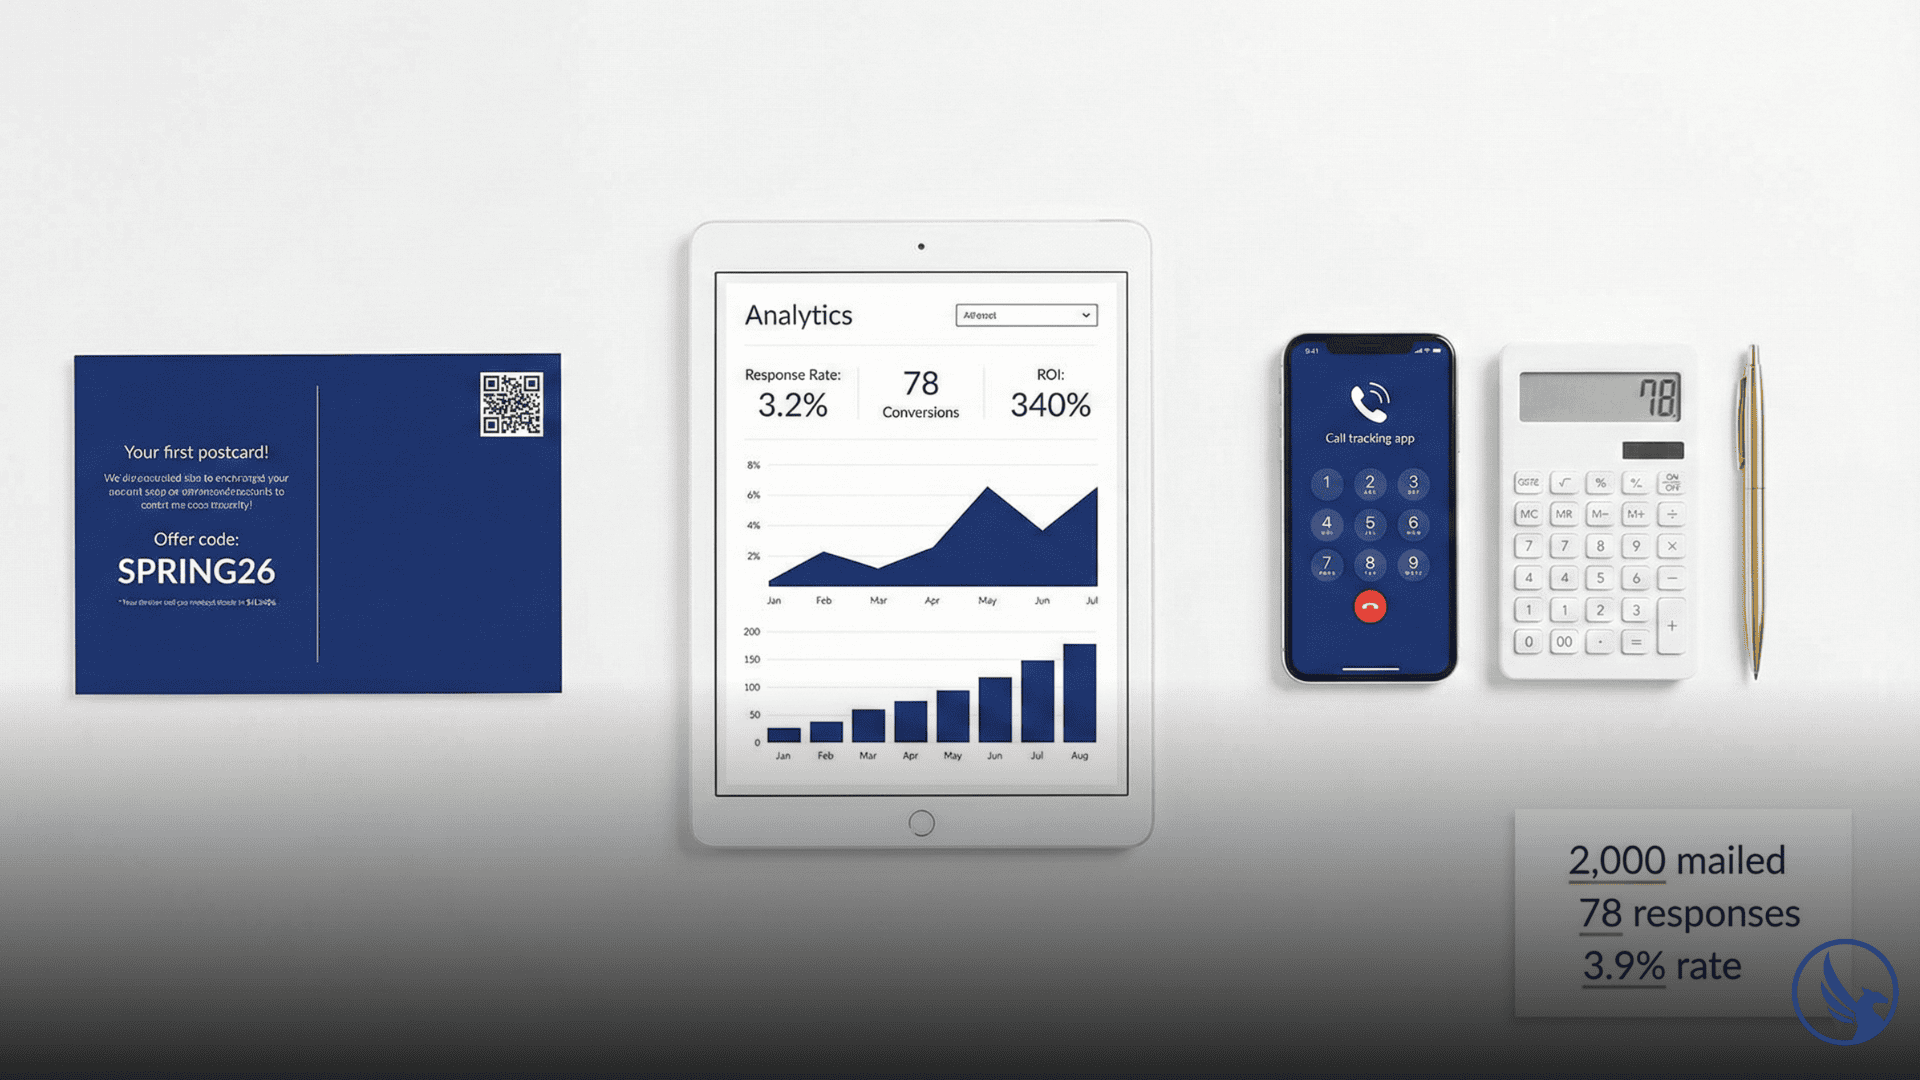
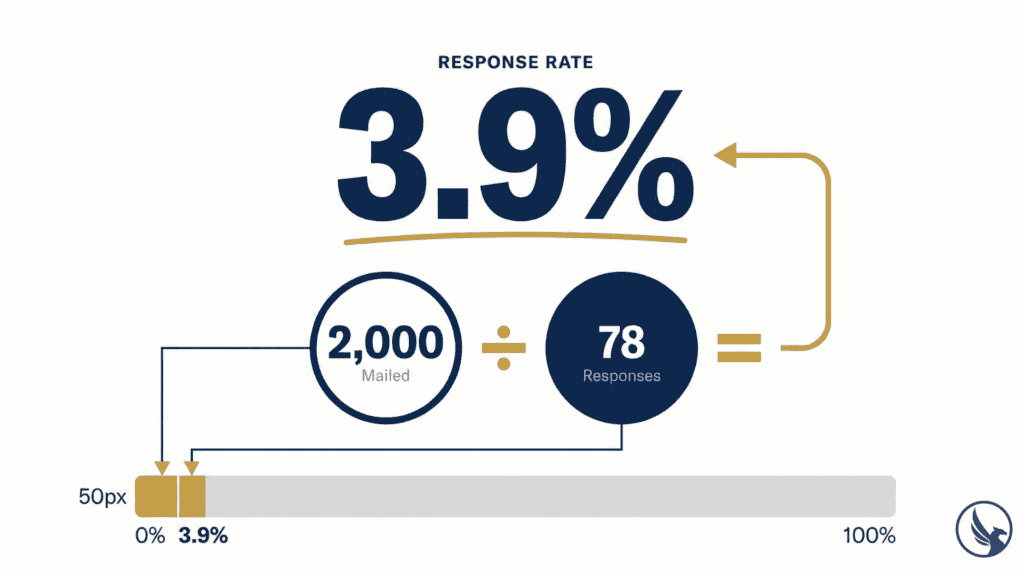
Example:
- 2,000 postcards mailed
- 47 returns as undeliverable
- 78 tracked responses
- Adjusted response rate: 78 ÷ 1,953 × 100 = 3.99%
According to industry data, typical direct mail response rates range from 1-5% for prospect lists and 5-9% for house lists, making a 3.99% response rate a solid performer for cold outreach.
Start Tracking Your Postcard Campaigns
Direct mail postcard tracking methods transform guesswork into strategy. Specifically, when you know exactly which campaigns generate which results, optimization becomes possible—and profitable.
The businesses scaling their direct mail programs in 2026 track everything. Consequently, they know their response rates by list type, by offer, by design, by season. That data compounds into a competitive advantage their untracked competitors can’t match.
Measure everything. Optimize relentlessly. Scale what works.
For more detailed guidance on postcard specifications and campaign planning, see our Postcard Printing and Mailing Services Guide.