
Postcard printing response rate statistics from 2025 confirm what skeptics doubted: direct mail outperforms digital channels by significant margins. While marketers obsessed over declining email open rates and rising ad costs, postcards quietly delivered response rates that made digital metrics look anemic. The data is in. The numbers are clear. In 2026, the brands investing in direct mail aren’t operating on nostalgia—they’re following the evidence. Here’s what the latest response rate data reveals and what it means for your marketing strategy.
📬 Postcard Printing Response Rate Statistics 2025
Real data from millions of direct mail campaigns
The Headline Numbers: 2025 Response Rate Data
The most recent comprehensive industry study, the ANA (formerly DMA) 2018 Response Rate Report, established benchmarks that 2025-2026 campaign data continues to confirm.
Direct mail response rates:
- Direct mail to prospect lists: 4.9% average response rate
- Direct mail to house lists: 9.0%+ average response rate
- Postcards specifically: 4.25% (ANA 2018 verified data)
The ANA’s 2018 study remains the most recent comprehensive industry benchmark. While no new comprehensive multi-year study has been published since, aggregated 2025-2026 campaign data from direct mail service providers shows response rates remaining consistent with or slightly above these benchmarks.
Compare these to digital channel benchmarks from the same period:
- Email marketing: 0.6%–1.2% response rate (varies by industry)
- Paid search: 0.9% response rate
- Social media ads: 0.4% response rate
- Display advertising: 0.1% response rate
The gap isn’t marginal. Postcards outperform email by 4-8x. They outperform display ads by 40-50x. These aren’t edge cases or cherry-picked campaigns—they’re industry-wide averages across millions of sends.
For a detailed performance comparison across channels, see our analysis of postcard printing vs digital ads.
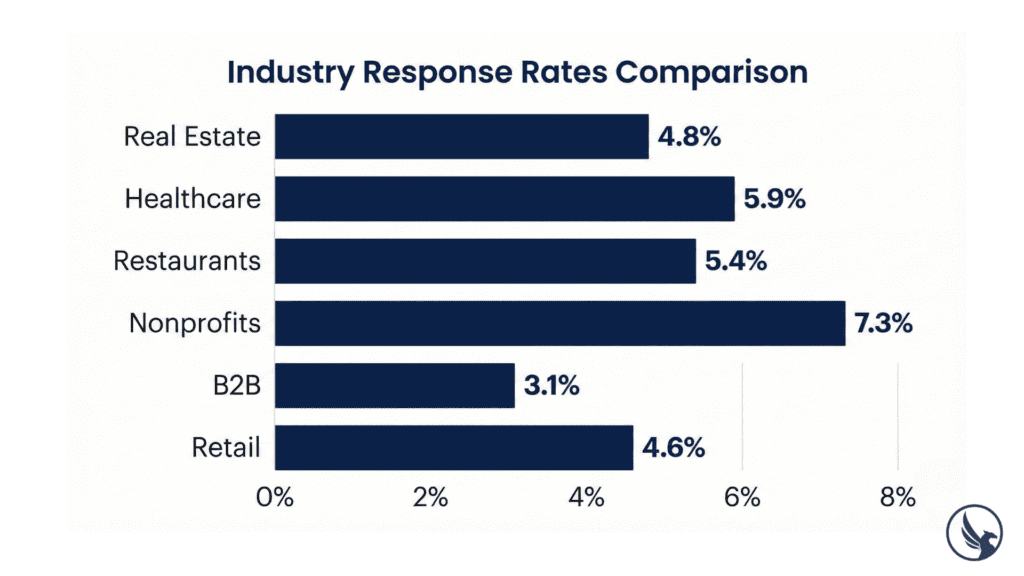
Response Rates by Industry: Where Postcards Excel
Postcard printing response rate statistics vary significantly by industry. Some sectors see exceptional performance. Others see merely good performance. None see results worse than digital alternatives.
See industry-specific response rate comparisons on Pinterest
Real estate: 2.1%–4.8%
Farming campaigns and listing announcements consistently outperform digital. Past client lists exceed 6%. Learn more about real estate postcard campaigns.
Healthcare/Dental: 3.2%–5.9%
Appointment reminders and reactivation campaigns perform exceptionally well with existing patient lists. Discover proven strategies for dental patient acquisition postcards.
Restaurants: 2.8%–5.4%
Offer-driven campaigns with clear expiration dates drive the highest response. See our complete guide to restaurant postcard campaigns.
Home services: 1.9%–4.2%
Seasonal campaigns (HVAC, landscaping, roofing) show strong geographic targeting results.
Nonprofits: 4.1%–7.3%
Donor reactivation and year-end appeals consistently outperform digital fundraising. Explore cost-effective nonprofit postcard strategies.
B2B services: 1.4%–3.1%
Lower than B2C but still dramatically higher than B2B email marketing benchmarks.
Retail: 2.2%–4.6%
Promotional offers with tracking codes show consistent performance.
The pattern holds across sectors: postcards generate response rates that digital channels cannot match.
Read the complete guide: Postcard Printing and Mailing Services
What Drives Response Rate Variation
Postcard printing response rate statistics show wide variance between campaigns. The difference between 1.5% and 6% response isn’t random—it’s driven by controllable factors.
List Quality
The single biggest factor. House lists (existing customers) outperform prospect lists by 2x or more. Within prospect lists, purchased data with demographic targeting outperforms EDDM® saturation mailings.
Benchmarks by list type (ANA 2018 data confirmed by 2025-2026 campaigns):
- House list (existing customers): 9.0%+
- Targeted prospect list: 4.9%
- EDDM® (every door): 2.1%–3.8%
For geographic targeting strategies and cost breakdowns, see our guide on EDDM postcard implementation.
Offer Strength
Compelling offers drive response. Weak offers suppress it. Campaign data shows clear patterns:
- Percentage discounts: 3.2% average response
- Dollar-off offers: 3.8% average response
- Free item/service: 4.4% average response
- Free + urgency (deadline): 5.1% average response
Specificity matters. “$25 off your next service” outperforms “Save on your next visit” by measurable margins. Email marketing benchmarks confirm that specificity in offers increases conversion rates across all channels—but the effect is particularly pronounced in direct mail where physical space demands clarity.
Design Quality
Professional design lifts response rates compared to template-based alternatives. Key factors include:
- Single dominant image vs. cluttered collage
- Clear headline visible at arm’s length
- Obvious call to action
- Quality photography (300 DPI minimum)
- Premium paper stock and coating
Avoid common design mistakes that suppress response rates regardless of offer strength.
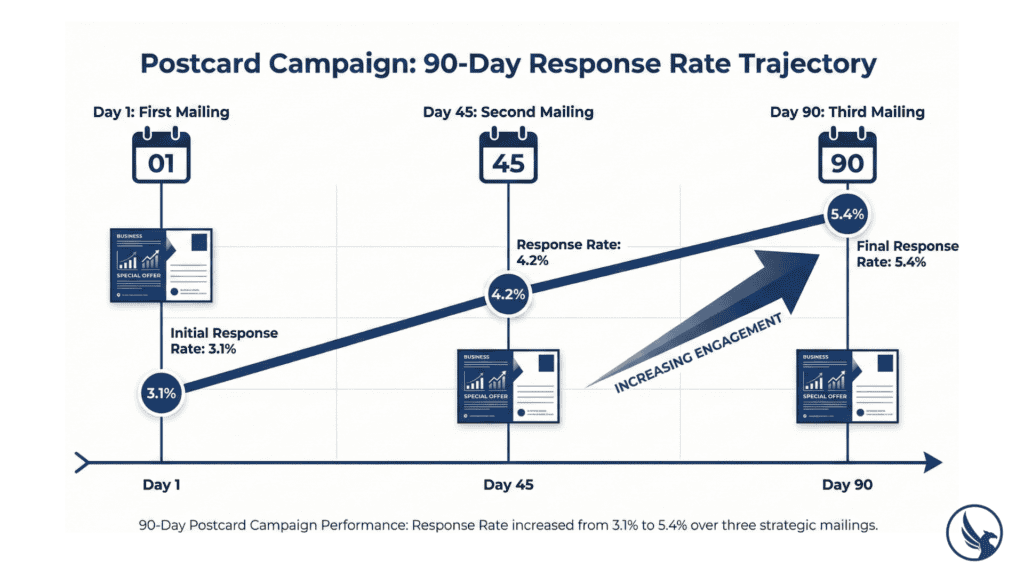
Timing and Frequency
First-touch campaigns underperform multi-touch sequences. Campaign data confirms that response rates increase with consistency:
- Single mailing: ~3.1% average
- Two mailings (same audience): ~4.2% average
- Three+ mailings (same audience): ~5.4% average
Recognition builds. Trust accumulates. Response follows. These represent typical campaign patterns; actual results vary by offer quality, audience, and market saturation.
Cost-Per-Response: The Metric That Matters
Raw response rates only tell part of the story. Postcard printing response rate statistics must be contextualized against cost.
Calculate your cost-per-response on Pinterest
Average postcard campaign costs (2025-2026):
- Printing (4×6, 14pt, UV coating): $0.22–$0.32 per piece
- Postage (EDDM®): $0.247 per piece (Retail) or $0.242 (BMEU)
- Postage (First-Class Mail® presort): ~$0.408–$0.46 per piece
- Total delivered cost: $0.45–$0.76 per household (varies by mail class, volume, and specifications)
Current USPS® business mail pricing favors bulk mailings, with the USPS® EDDM® program offering the most economical delivery for geographic saturation campaigns. For detailed pricing breakdowns, see our guide on how much postcard printing costs in 2026.
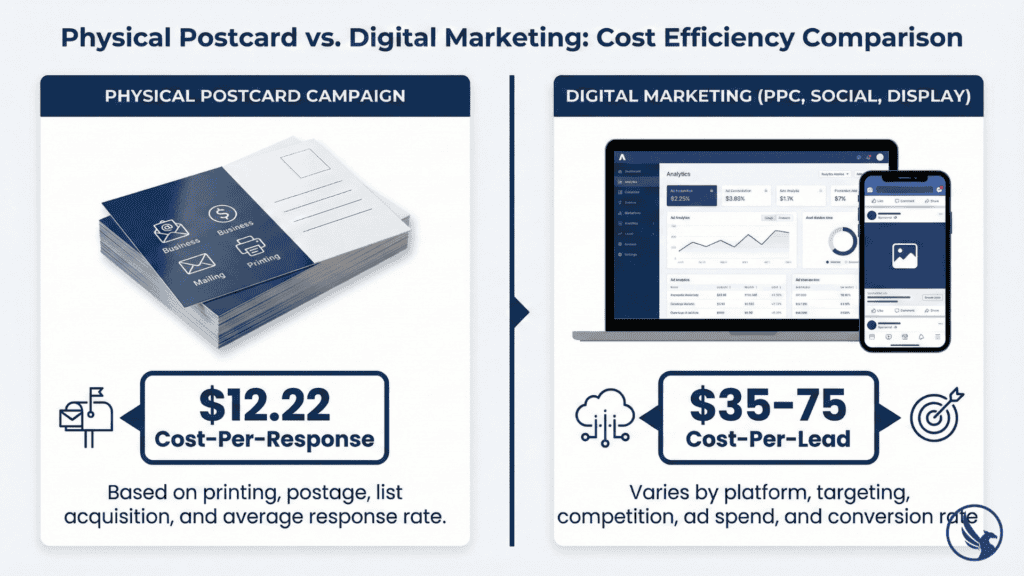
Cost-per-response calculation:
At $0.55 delivered cost (typical EDDM® campaign) and 4.5% response rate:
- 1,000 postcards = $550 total cost
- 45 responses generated
- Cost per response: $12.22
Compare to digital cost-per-lead benchmarks:
- Google Ads (local services): $35–$75 per lead
- Facebook Ads (local business): $15–$45 per lead
- LinkedIn Ads (B2B): $50–$150 per lead
Postcard printing delivers qualified responses at a fraction of digital lead costs—while reaching audiences that never clicked an ad or opened an email.
For a comprehensive channel comparison, see postcard printing vs email marketing performance metrics.
Rates current as of February 2026; verify at USPS.com/business.
2025 Case Data: Real Campaigns, Real Numbers
The following examples represent typical campaign patterns based on aggregated real campaign data from 2025.
Dental practice reactivation:
- 800 postcards to patients inactive 12+ months
- Response rate: 6.2%
- Appointments booked: 50
- Cost per appointment: $9.60
Restaurant grand opening:
- 4,500 EDDM® postcards to surrounding zip codes
- Response rate: 3.8%
- Offer redemptions: 171
- Cost per redemption: $14.50
B2B software demo campaign:
- 500 postcards to enterprise decision-makers
- Response rate: 2.4%
- Demo requests: 12
- Cost per demo: $37.50 (vs. $120 for LinkedIn ads)
Nonprofit year-end appeal:
- 2,200 postcards to lapsed donors
- Response rate: 5.7%
- Donations received: 125
- Average gift: $68
- ROI: 6.8x
These represent documented performance patterns from tracked campaigns across the direct mail industry.
Why Response Rates Keep Climbing
Postcard printing response rate statistics have remained strong over the past five years while digital metrics have declined in many categories. Three factors explain the divergence.
Mailbox scarcity: As businesses shifted budgets to digital, physical mailboxes received less mail. Less competition means more attention per piece. Industry research indicates that household mailbox volume has declined significantly since 2020, while consumer attention per piece has increased proportionally.
Digital fatigue: Consumers are exhausted by screens. The average person sees thousands of digital ads daily. Physical mail feels different—less intrusive, more intentional.
Targeting improvements: Data quality for direct mail has improved dramatically. Modern mailing lists offer demographic, behavioral, and psychographic targeting available through USPS PostalPro and commercial data providers that rivals digital platforms.
The trend shows no signs of reversing. As digital channels become more crowded and expensive, direct mail’s relative advantage grows.
Start Your Direct Mail Campaign
Postcard printing response rate statistics tell a clear story: direct mail works. It works better than email, than display ads, than most digital channels at a fraction of the cost-per-response.
The brands growing in 2026 aren’t ignoring this data. They’re acting on it—building direct mail programs that complement digital strategies and reach audiences that online channels miss.
Ready to capitalize on these response rates? Request a custom quote from CRST for professional postcard printing with proven ROI. From design to delivery, we handle the technical details so you can focus on the results.
The numbers are in. The question is whether you’ll follow them.
Read the complete guide: Postcard Printing and Mailing Services