
Direct mail vs social media ads is one of the most common budget decisions facing local businesses today. Most people frame it incorrectly. The question is not which channel is better in the abstract. The real question is which channel produces a better return for your specific business, audience, and offer. That answer depends on variables that are measurable — not on instinct or platform familiarity.
This guide compares both channels across the metrics that matter: cost per lead, response rate, targeting precision, creative requirements, and attribution. Use it to allocate budget with data rather than assumptions. For businesses already running or considering EDDM, the EDDM Guide at CRST provides the production foundation. For the broader strategic framework, Direct Mail Marketing Strategy and Why Direct Mail Still Works are essential context before running this comparison.
Why the Channel You Choose Changes Everything
The channel you choose determines more than cost — it determines the audience state, the competitive environment, and the persistence of your message. Understanding those differences upfront prevents the most common direct mail vs social media budget mistakes.
- Customer base is geographically defined
- Broad local appeal — food, services, health
- Predictable cost structure matters
- Audience is 45+ with lower social engagement
- Creative longevity reduces per-drop cost
- Narrow, behaviorally definable audience
- National or broad geographic reach
- Rapid creative iteration is required
- Video storytelling drives purchase
- Retargeting known website visitors
The Core Difference Between Direct Mail and Social Media Ads
How Each Channel Reaches Your Audience
Direct mail and social media advertising reach audiences through fundamentally different mechanisms. That difference shapes every downstream metric in the comparison.
Social media ads operate on an attention-rental model. You pay a platform — Meta, Google, TikTok, LinkedIn — for access to its users’ attention inside a feed. That feed competes for attention with content from friends, family, competitors, and every other advertiser bidding for the same impression. The platform’s algorithm determines when your ad appears, to whom, and for how long. In other words, you rent visibility within an environment you do not control.
Direct mail operates on a delivery model. You pay for a physical object to be placed in a specific person’s mailbox. It exists independently of any algorithm, platform policy change, or feed ranking. The recipient controls the interaction, but the piece persists. A postcard on a kitchen counter continues to generate impressions for days or weeks after delivery. A social ad impression, by contrast, lasts for the fraction of a second it takes to scroll past.
These two mechanisms also produce different audience states at the moment of contact. Social media users are typically in a passive, entertainment-oriented mindset when ads appear. Direct mail recipients, however, are actively sorting through their mail — a more deliberate behavior that research consistently links to higher engagement. According to USPS consumer mail research, 98% of consumers bring in their mail the day it is delivered, and 77% sort through it immediately.
Advisory: The 98%/77% figures are consistent with published USPS Mail Moments research. Verify the specific figures in the current edition at postalpro.usps.com before citing in client-facing materials, as USPS updates this study periodically.
The Attention Economy Problem With Social Ads
The average person sees thousands of digital ads per day across all platforms. Consequently, attention is the scarcest resource in digital advertising — and its cost rises every year as more advertisers compete for the same inventory.
Advisory: The commonly cited “4,000–10,000 ads per day” figure originates from older media consumption research and the upper bound is contested. Verify against current studies before using in client-facing materials.
Direct mail, in contrast, operates in a less congested environment. The average household receives a small number of mail pieces per day — dramatically lower competitive density than the digital feed.
Advisory: The “two pieces of mail per day” average is directionally consistent with USPS volume data. Verify current average household mail volume at postalpro.usps.com or in USPS annual reports before citing specifically.
As a result, a well-designed postcard commands a proportionally higher share of attention than an equivalent social ad unit — independent of creative quality. For the statistical foundation of direct mail’s engagement advantage, Direct Mail ROI Statistics 2026 covers the current benchmark data set across audience types and categories.
Direct Mail vs Social Media Ads: Cost Per Lead Comparison
What Social Media Advertising Actually Costs
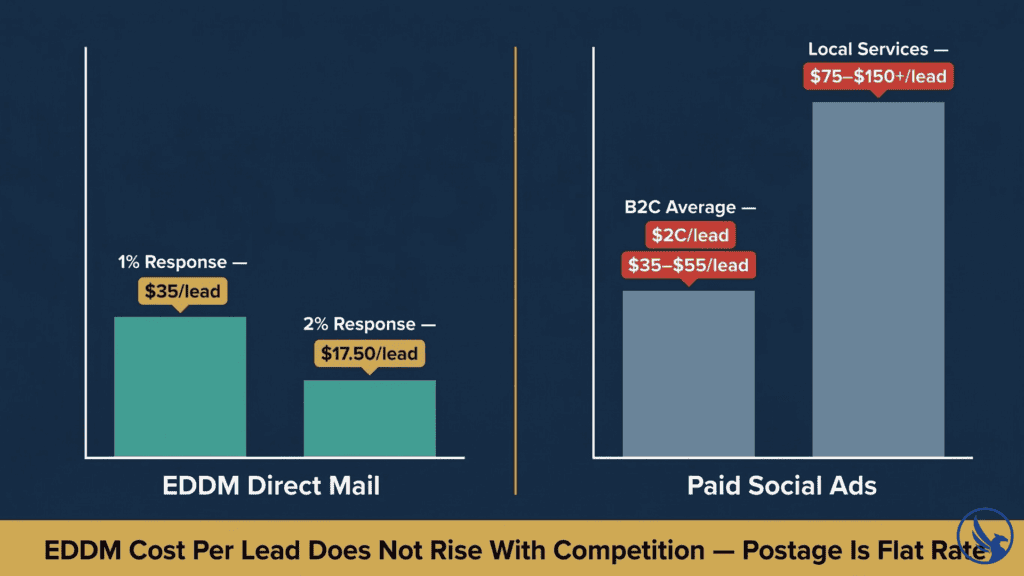
Social media advertising cost per lead varies enormously by platform, audience, industry, and competitive bidding environment. According to industry digital advertising benchmarks, Facebook/Meta average cost per click runs roughly $0.94–$3.78 across industries. However, cost per lead — accounting for landing page conversion rates — typically runs $5–$55 for B2C categories. Professional services run $50–$200+.
For local service businesses in competitive categories — home services, dental, legal, financial services — paid social cost per lead routinely runs $35–$150+. Moreover, this is before accounting for management overhead: ad creative production, audience testing, ongoing optimization, and platform fees.
Advisory: Social media advertising benchmarks shift with platform algorithm changes, competitive density, and macroeconomic cycles. The figures above are directional references. Verify current benchmark data at wordstream.com/resources before building budget models.
What Direct Mail Costs Per Lead
Direct mail cost per lead is total campaign cost divided by attributed responses. For EDDM campaigns, total cost per piece runs approximately $0.32–$0.40 — based on $0.247 USPS EDDM Retail postage plus typical print costs.
Advisory: The $0.247 EDDM Retail postage rate reflects pricing at time of publication. Verify the current rate at usps.com/business/every-door-direct-mail.htm before building budget models.
At a conservative 1% response rate on a 5,000-piece campaign — roughly $1,750 total — that produces 50 responses at $35 per lead. At 2% response, the same campaign produces 100 leads at $17.50 each. Furthermore, direct mail cost per lead does not inflate with competition. A saturated local dental market on Meta drives up CPL for every competitor bidding on the same audience. The same saturation, however, has no effect on a dental postcard mailing — postage rates do not respond to competitive bidding pressure.
For the full cost modeling framework, Direct Mail Cost Per Piece covers production cost variables. Direct Mail ROI 2026 models expected returns across volume tiers and industry categories. To verify actual returns from your own campaigns, How to Measure Direct Mail ROI provides the full attribution framework. You can also model your own scenario using the Direct Mail ROI Calculator.
Response Rates: What the Data Shows
Direct Mail Response Rate Benchmarks
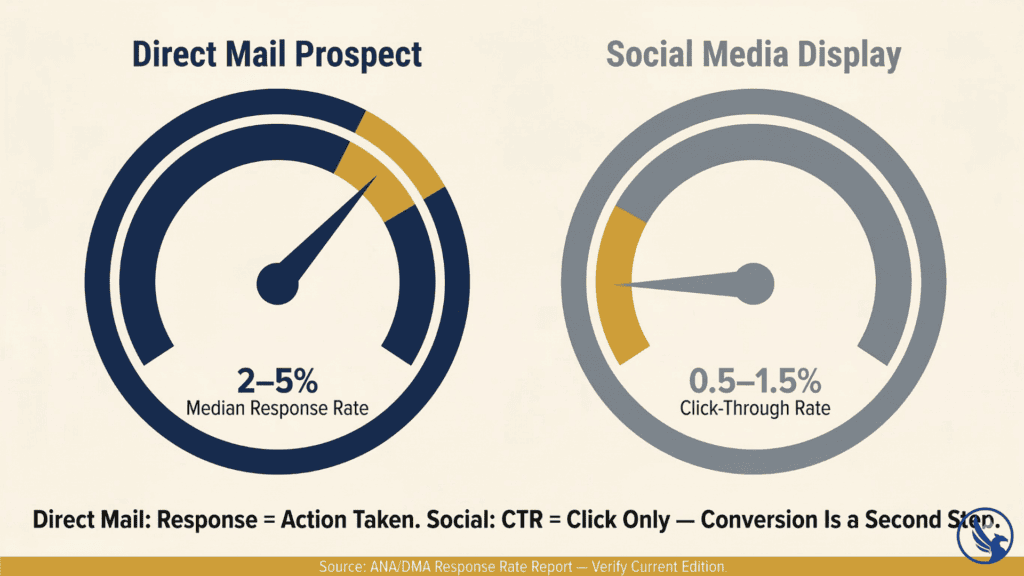
Direct mail response rates — as measured by the ANA/DMA annual Response Rate Report — consistently outperform digital alternatives on a per-impression basis. Specifically, prospect direct mail generates median response rates of 2%–5%. House lists (existing customers) generate 5%–9%.
Advisory: The series-standard prospect mail range throughout the CRST EDDM series is 1%–5%. The 2%–5% range cited here reflects well-targeted campaigns within that broader range. Verify the current edition of the Response Rate Report at thedma.org before using specific figures in client-facing materials.
Additionally, according to ANA/DMA research, direct mail response rates have increased in recent years as digital ad fatigue has reduced competitive pressure on physical mail’s share of attention. For EDDM-specific benchmarks by category, Direct Mail Response Rate by Industry covers the full range. For guidance on strong performance benchmarks for your specific format, Good Response Rate for Direct Mail provides the calibration framework.
Social Media Ad Response Rates in Context
Social media click-through rates average 0.5%–1.5% across platforms and industries for display and feed ads. Conversion rates from click to lead add a second attrition layer. For example, if your landing page converts 10% of clicks, a 1% CTR campaign produces a 0.1% conversion rate — below the floor of direct mail’s worst-performing campaigns.
Advisory: Social CTR and conversion benchmarks shift with platform changes and competitive density. Verify current figures at wordstream.com/resources before using in budget comparisons.
The comparison is not perfectly apples-to-apples. Nevertheless, the response rate data consistently supports the same conclusion: direct mail delivers more responses per 1,000 audience contacts than social advertising across most local business categories. For the complete data-driven breakdown, Direct Mail ROI Statistics 2026 provides the full statistical foundation.
Targeting: Where Social Media Has the Advantage
Social Media’s Targeting Precision
Social media advertising’s primary competitive advantage is granular audience targeting. Meta’s ad platform allows targeting by age, gender, location radius, interests, behaviors, life events, income bracket, home ownership status, relationship status, employer, and hundreds of additional parameters. You can reach 35–45-year-old homeowners within 10 miles of your business who have recently engaged with home renovation content. No physical mail list can replicate that specificity at equivalent cost.
This precision is most valuable where the ideal customer profile is highly specific and geographically dispersed — luxury goods, niche professional services, B2B products, and high-consideration purchases. In these categories, social media’s targeting advantage can produce lower cost per acquisition than direct mail. However, targeting precision has diminishing returns at the local level. A dental practice targeting a 3-mile radius has an audience small enough that geographic saturation is more efficient than behavioral targeting within the same geography.
Direct Mail Audience Targeting and Direct Mail List Segmentation cover how direct mail targeting can be refined beyond simple geographic saturation when campaigns require it.
Where Direct Mail Targeting Is Sufficient
For most local service businesses — restaurants, home services, dental, gyms, salons, retail — the most important targeting variable is simply geography. The customer drives or walks from within a defined radius. Beyond that, demographic filtering by income, home ownership, and age provides sufficient alignment for broadly appealing offers.
Consequently, social media’s behavioral targeting delivers limited incremental value over well-selected direct mail geography — while carrying meaningfully higher management overhead and cost volatility. For a structured planning framework, How to Create a Direct Mail Campaign and Direct Mail Campaign Planning walk through every decision point from audience to offer to creative.
Creative Requirements and Production Overhead
What Each Channel Demands Creatively
Social media advertising has an insatiable creative appetite. Platform algorithms reward fresh creative — Meta’s own guidance recommends rotating new ad creative every 1–2 weeks. For a business running a continuous social campaign, that means producing new images, copy, and often video on a near-constant cycle. Most small business social media ROI calculations undercount this recurring overhead.
Direct mail campaigns have a different creative model. A well-designed postcard with a strong offer can run for multiple drops with minimal modification — a seasonal offer update or a date change. The upfront design investment therefore amortizes across multiple campaign uses. For the creative framework that produces high-performing direct mail pieces, Best Direct Mail Format for Response Rate covers format selection and design hierarchy. For integrating QR codes and UTM-tagged URLs, Direct Mail QR Codes and Digital Integration is the essential companion resource.
Attribution: A Complexity Both Channels Share
Neither channel makes attribution perfectly simple. Social platforms provide click-through and conversion data within their own ecosystems. However, they increasingly struggle with accurate attribution as iOS privacy changes, cookie deprecation, and cross-device behavior fragment the conversion path. Platform-reported ROAS frequently overstates actual campaign contribution.
Direct mail attribution requires deliberate tracking infrastructure — dedicated phone numbers, QR codes with UTM parameters, campaign-specific landing pages. Nevertheless, it produces attribution data independent of any platform’s self-reported metrics. For the full methodology, How to Measure Direct Mail ROI covers every tracking mechanism. For A/B testing frameworks that isolate and optimize creative variables across drops, Direct Mail A/B Testing provides the structured experimental approach.
When to Choose Direct Mail, Social, or Both
The Cases Where Direct Mail Wins
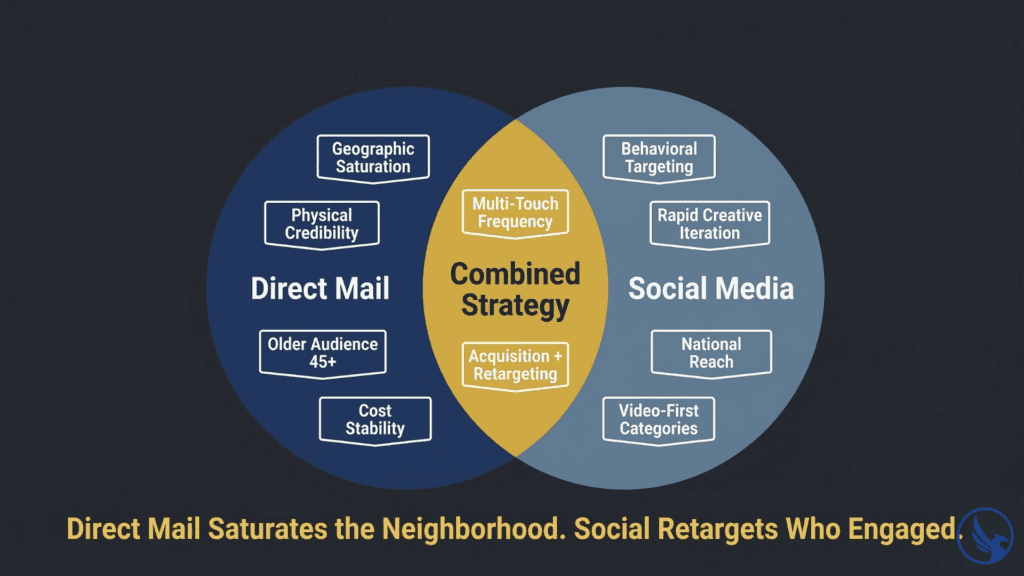
Direct mail wins clearly in several scenarios: local service businesses with geographically defined customer bases; high-ticket purchases where physical presence signals credibility; categories with older primary audiences (45+) who have lower social media ad engagement; and any campaign where cost stability matters more than real-time audience refinement.
For small businesses making their first significant marketing investment, direct mail’s predictable cost structure makes budgeting more reliable than social advertising, where CPL can shift dramatically with competitive bidding changes. Direct Mail for Small Business frames the first-campaign decision framework. For industry-specific guidance, Direct Mail for Financial Advisors, Direct Mail for Insurance Agents, and Direct Mail for Chiropractors cover the category-specific campaign models. Additionally, Direct Mail as an Alternative to Cold Calling covers the B2B context where direct mail replaces rather than supplements digital outreach.
The Cases Where Social Media Wins
Social advertising wins when the target audience is highly specific and behaviorally definable, the campaign requires rapid iteration, the product has national reach, or the brand category is video-first — fashion, entertainment, consumer packaged goods. In these categories, social media’s real-time feedback loop produces returns that direct mail cannot match at equivalent spend.
For most local businesses, however, the answer is not binary — it is an allocation decision. Direct mail handles geographic saturation and brand persistence. Social handles behavioral retargeting and lookalike audience expansion. Run together, they create the multi-touchpoint contact frequency that either channel alone cannot achieve.
For personalization capabilities that bring direct mail closer to social’s audience specificity, Personalized Direct Mail and Variable Data Printing covers name, offer, and creative variation at scale. Campaign frequency strategies that optimize both channels over time, Direct Mail Frequency Best Practices provides the timing and cadence framework. For mistakes that undermine ROI in a combined channel strategy, Direct Mail Mistakes to Avoid is essential pre-launch reading. For businesses planning their full campaign architecture, Direct Mail Services at CRST covers the full-service production offering. Direct Mail Trends 2026 frames the broader channel landscape for current planning decisions.
Start Your Direct Mail Campaign with CRST
The direct mail vs social media ads decision comes down to a single question: does your ideal customer live within a geographic radius you can saturate, or do they require behavioral targeting to find? For most local businesses, the answer points clearly to direct mail — with social as a complementary retargeting layer rather than the primary acquisition channel.
CRST handles EDDM printing from file setup through postal delivery, with a team that knows USPS compliance inside out and a track record across industries. Explore our full direct mail printing services, request an estimate, or contact our team to discuss campaign options tailored to your business category.
For the complete breakdown of how the program works, see our EDDM Guide.